AI and these jobs
Come here for the full story on AI and post-MBA jobs: how we measured it, where the risk sits and what to do about it.
There is no question, AI is shaking up the global workforce in a major way. A 2026 PwC survey found 86% of financial services executives call AI training more valuable than an MBA for many new hires. Even a GMAC study (published by those pesky writers of the GMAT) confirms that AI is beginning to encroach on jobs that MBAs could historically count on as a sort of MBA finishing school – entry level positions at top finance and consulting firms, for example.
TL;DR: AI will make life on planet earth better (hopefully), but first it’s gonna shake things up. A lot. Even MBAs aren’t immune to the creep of AI into our cubicles and corner offices. But here’s the plot twist: the work MBAs get hired to do – making the call and owning the outcome – is the work that increases in value in an AI-boosted world. Compared with the other office jobs out there, including the one you probably have right now, post-MBA jobs look pretty darn safe.
How we built these charts
We used the Anthropic Economic Index, which publishes actual AI-exposure scores for 756 O*NET occupations and penetration scores for roughly 18,000 O*NET tasks, built from millions of real Claude conversations classified against the O*NET task taxonomy. They are looking at which tasks are actually currently being done with or by AI. Then they rolled up the task bases and scored each function 0 to 100 for AI exposure: the share of that occupation's task time where AI use is already observed in real work. As you might expect: financial analysts have a pretty high exposure score. Nail technicians, not so much.
We then took MBA job functions declared by schools and did our best to map them to the O*NET occupation database so we could calibrate them against Anthropic’s numbers. This is the weakest link in the chain. O*NET has no occupation for product managers, private equity associates, or consultants at the post-MBA level, and for most functions there are two reasonable matches that score very differently. AI 1 shows both.
A score of 30 means roughly 30% of the task time in that occupation is in tasks where AI use is already observed.
It does not mean…
- 30% of the roles are disappearing
- 30% of graduates will lose their jobs
- 30% of a person’s job that goes away.
This data cannot tell us whether a job survives, whether an industry grows or shrinks, or how pay and seniority evolve. It cannot distinguish within a function either -- a data scientist doing model interpretation and one doing routine reporting score identically here and face very different futures.
Funny meta comment: Note that the product of the company that created the index (Claude, made by Anthropic, also the product we used to assist us in building this report) is both used to create the index and the reason we need the index in the first place. Pretty soon, it will just be robots talking to robots and we humans can all go to the beach.
AI 1
How much of each post-MBA job is AI already doing?
TL;DR: Most post-MBA functions land in the middle of this 100-point scale created by Anthropic, and where exactly depends on which official occupation you match them to. Higher scores mean more AI invasion. Finance and investing, analytics and marketing come out highest. General management and operations come out lowest. Consulting sits in between at 24. So we give you a range: a lower bound and an upper bound.
Again, the number represents Anthropic’s AI-exposure score for the function based on current actual AI usage in these functions. Lower numbers = less AI encroachment.
The catch, and why you get a range. Anthropic scored the U.S. government’s official list of occupations, called O*NET. “Post-MBA product manager” isn’t on it, so we had to pick the closest official occupation for each MBA function. That’s the most subjective part of this analysis. Usually two occupations could fit, so we show both scores: the lower bound and the upper bound. Your real job lands somewhere in between.
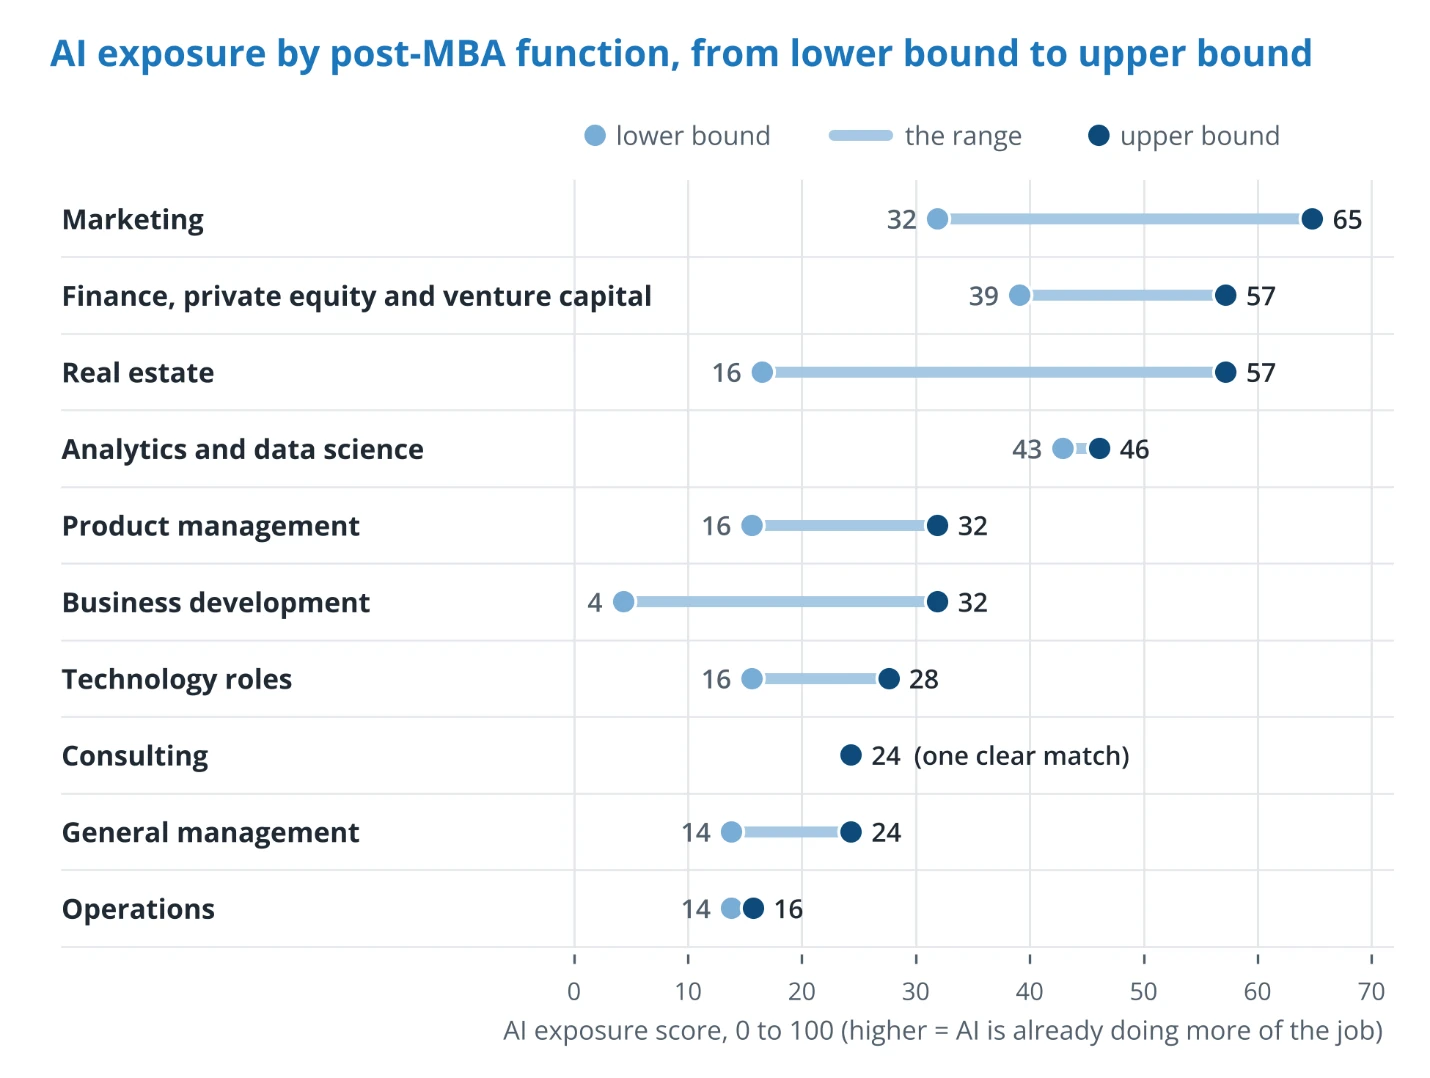
How to read the chart. Light dot = lower bound, dark dot = upper bound. The longer the line, the more the two matches disagree, so hold that score loosely.