Getting in
Come here for the numbers behind your odds: applications, acceptance rates and the class averages you’re up against.
Admissions 1
Applications and seats by entering class
TL;DR: About 17,000 more applications are chasing basically the same number of seats. That is the whole reason it got harder.
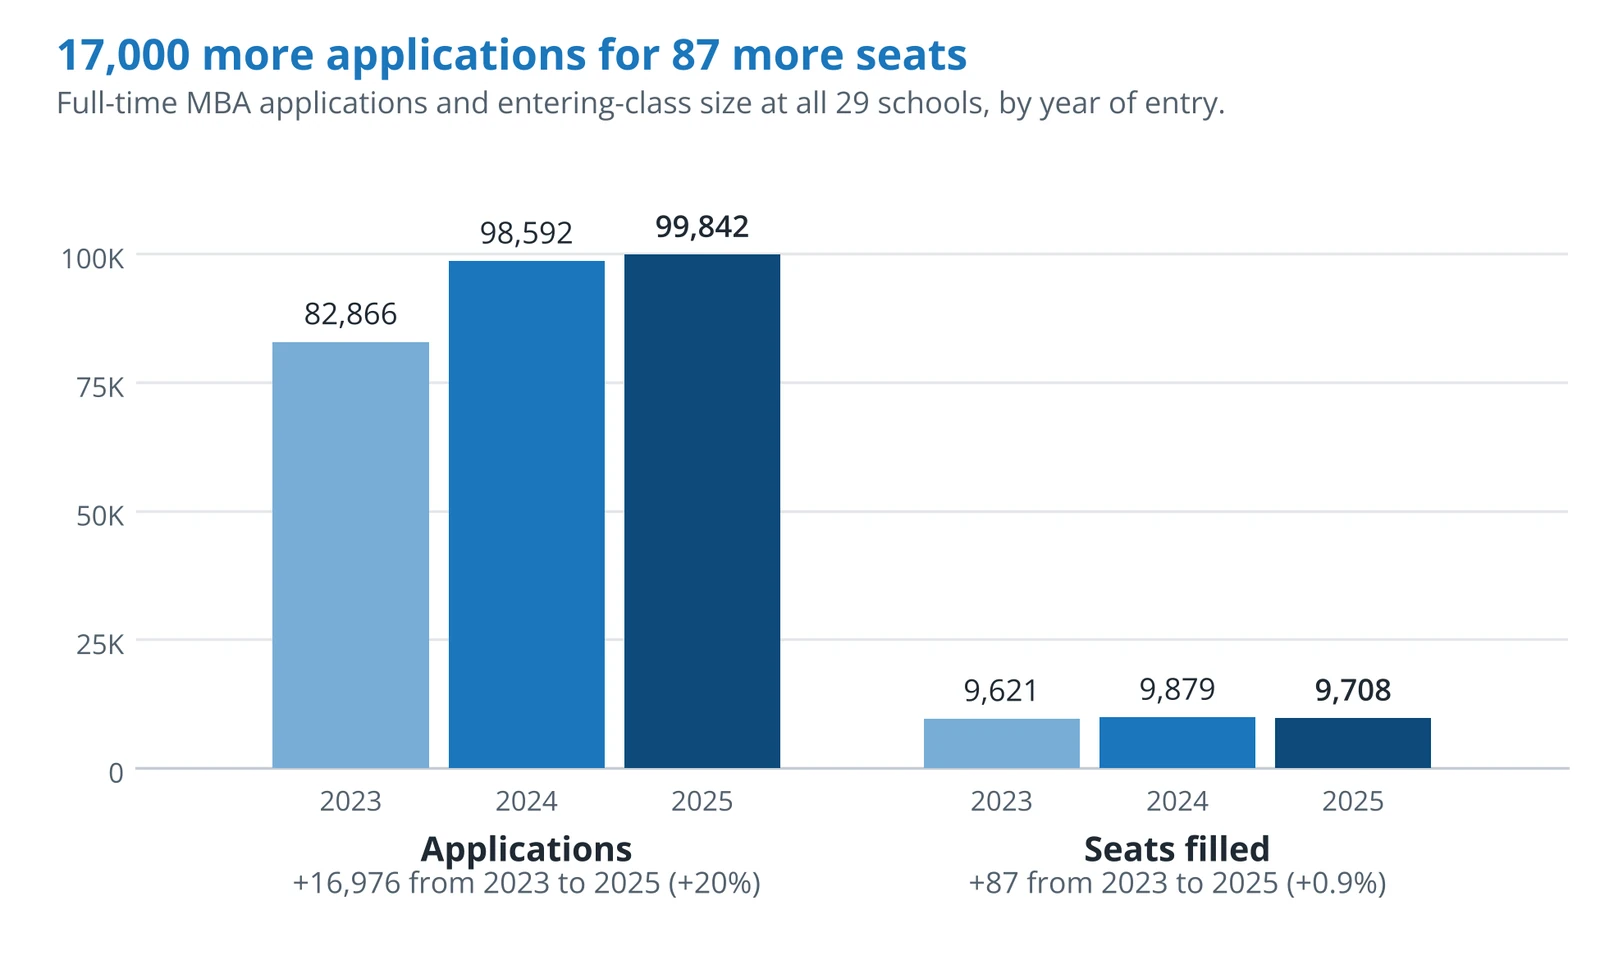
Data nerd note: “2025” in this chart means the class that started school in fall 2025, a.k.a. the Class of 2027. Kellogg and Haas don’t publish application totals, so theirs are Poets&Quants’ estimates. The 7% rise in offers covers the 25 schools that publish offer counts.
Source
Source note: Full-time MBA applications and entering-class size at all 29 schools, by the year the class started school. From school class profiles, Poets&Quants and Clear Admit.