Industries
Come here once you know the industry you want. These charts show which schools actually send people there, and how many.
Industry 1
Where the Class of 2025 went, all 29 schools
TL;DR: Most MBAs land in just a few industries. The big move since our last report is consulting, down from 36% of hires in the Class of 2023 to 28% in the Class of 2025.
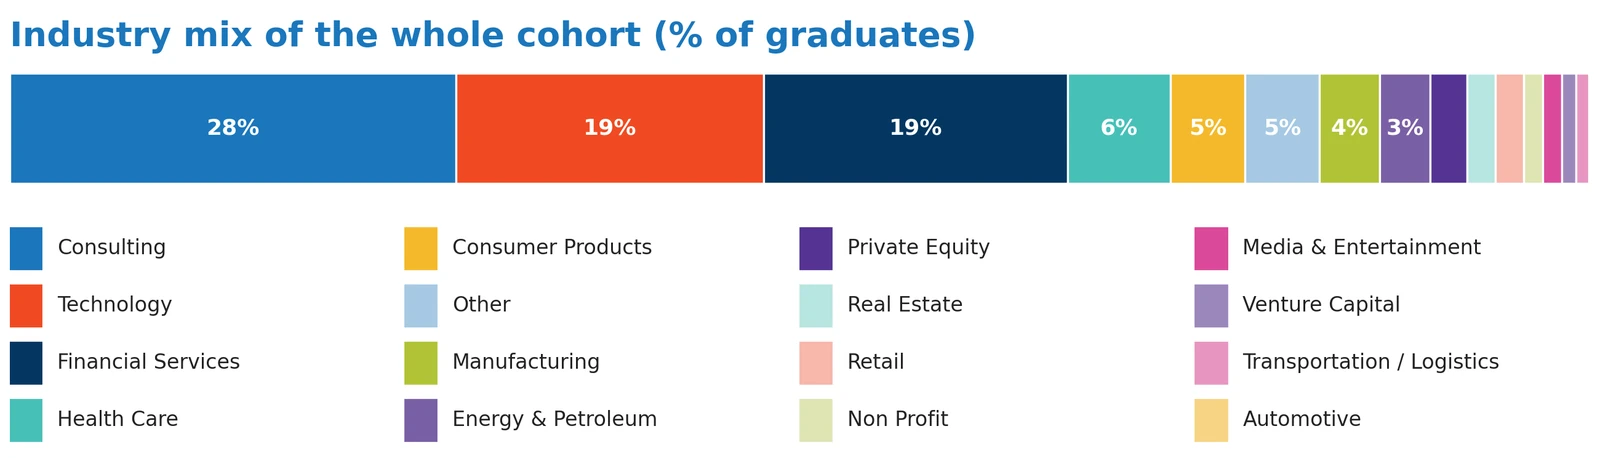
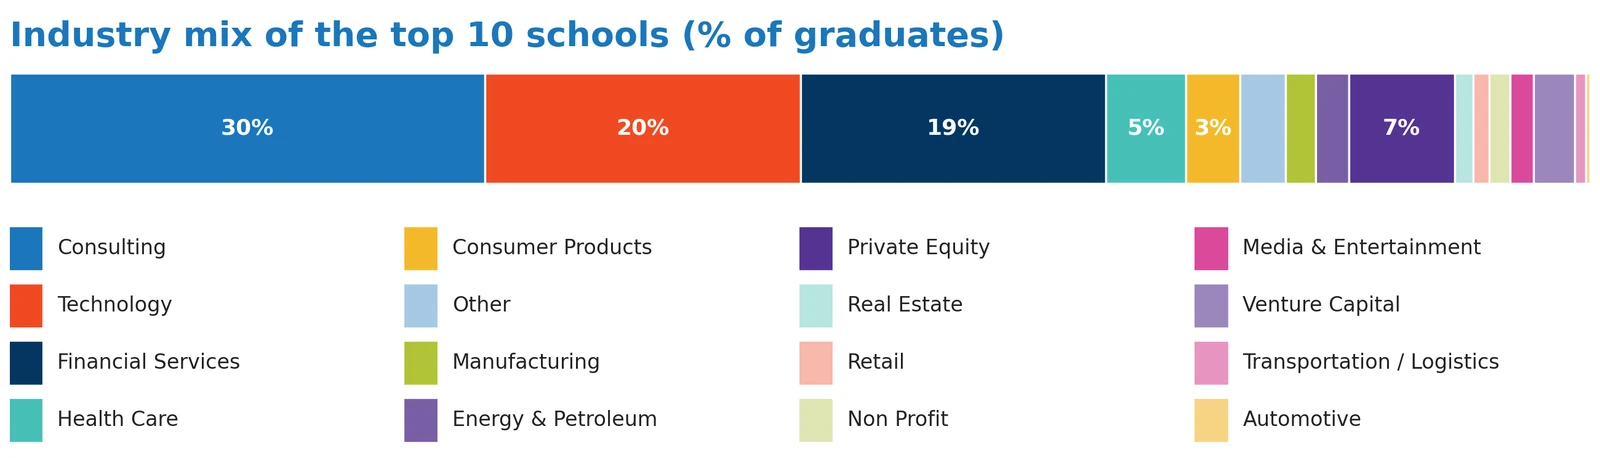
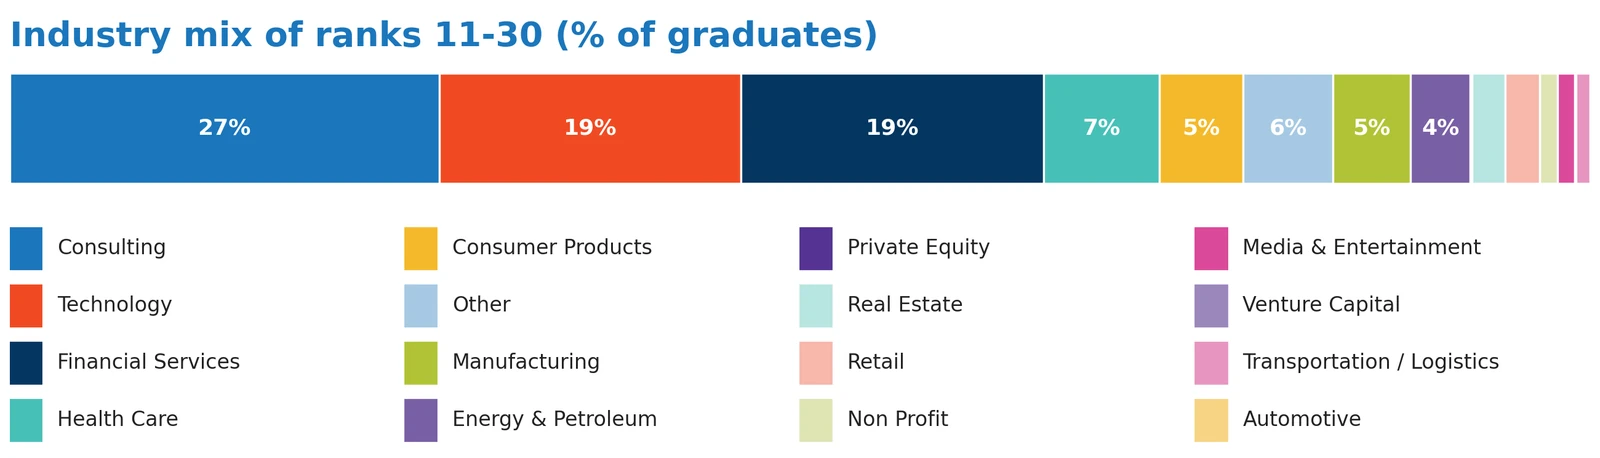
Data nerd note: Use these as your baseline. A school only looks “heavy” in an industry if it beats these numbers. Most schools outside the top 10 don’t break out private equity and venture capital, so those two show no bar for them.
Same data, table format
| Industry | All 29 schools | Top 10 schools | Next 19 schools |
|---|---|---|---|
| Consulting | 28.2% | 30.1% | 27.2% |
| Financial Services | 19.2% | 19.3% | 19.2% |
| Private Equity | 2.3% | 6.7% | 0.1% |
| Venture Capital | 0.9% | 2.6% | 0.1% |
| Technology | 19.4% | 20.0% | 19.1% |
| Health Care | 6.5% | 5.1% | 7.3% |
| Consumer Products | 4.7% | 3.4% | 5.3% |
| Manufacturing | 3.8% | 1.9% | 4.9% |
| Energy & Petroleum | 3.2% | 2.1% | 3.8% |
| Real Estate | 1.8% | 1.2% | 2.1% |
| Retail | 1.8% | 1.0% | 2.2% |
| Non Profit | 1.2% | 1.3% | 1.1% |
| Media & Entertainment | 1.2% | 1.5% | 1.1% |
| Automotive | 0.1% | 0.3% | 0.0% |
| Transportation / Logistics | 0.8% | 0.7% | 0.9% |
| Other | 4.7% | 2.9% | 5.7% |